Design and concept of CNFs-based OIA imprinted electronics
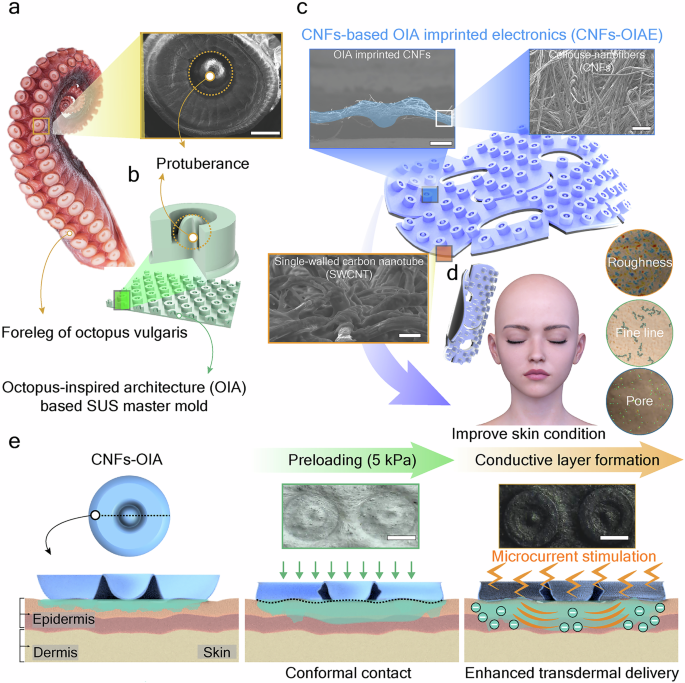
An octopus has a distinctive suction cup that allows it to firmly grasp its prey and attach to various surfaces (e.g., curved, rough, or irregular) underwater (Fig. 1a)34,35,36,37,38. These circular suction cups are concentrated on the legs of the octopus, and each has a unique protuberance inside. The protuberance helps create a vacuum environment that generates a suction force and enhances the underwater adhesion performance39,40,41. We fabricated a steel-use stainless-steel (SUS) master mold to imprint OIA onto CNFs (Fig. 1b). Through a simplified imprinting process using an SUS master mold, the CNFs were able to form a 3D structure. Structures mimicking the protuberance of the octopus were implemented at a high temperature (~150 °C) and pressure (500 MPa) (Fig. 1c). Additionally, a conductive layer was introduced to provide microcurrent stimulation. This conductive layer was formed through streamlined spray coating using a conductive material (single-walled (SWCNT)). As shown in Fig. 1d, the fully fabricated CNFs-based OIA-imprinted electronics (CNFs-OIAE) effectively improve skin conditions, including roughness, fine line, and pore size. The CNFs-OIAE were applied to the skin along with a high concentration of active ingredients, ensuring enhanced transdermal delivery. Afterward, a gentle preload was applied to induce structural deformation in the OIA (Fig. 1e). The deformed structure allows conformal contact with the skin and volume changes inside the OIA chamber, thereby enabling local negative-pressure generation. This negative pressure induces an additional suction force between the adhesive and the skin interface, which ensures robust adhesion performance. Finally, a voltage was applied to the conductive layer located on the opposite side of the skin attachment to amplify the delivery depth of the active ingredients. Approaches that apply intracorporeal microcurrents are remarkably effective in promoting the transdermal delivery of active ingredients from a multifaceted perspective. Specifically, it can induce repulsion between charged active ingredient particles to provide deeper penetration27,28. Additionally, it temporarily reduces the high electrical resistance of the stratum corneum of the skin, facilitating the movement of charged active ingredient particles30,31,32,33.

a Photographic image of the foreleg of Octopus vulgaris (left). Low magnification scanning electron microscope (SEM) image of a single octopus sucker (top right, scale: 1 mm). b Schematic of the steel-use stainless steel (SUS) mold with octopus-inspired architectures (OIAs). c Schematic of CNFs-based OIA imprinted electronics (CNFs-OIAE) (bottom right). Low-magnification SEM images showing CNFs (top right, scale: 100 μm), a single OIA imprinted on CNFs (top left, scale: 500 μm), and an SWCNT-based conductive layer (bottom left, scale: 10 μm). d Schematic illustrating improvements in skin conditions (roughness, fine line, and pore) through the application of CNFs-based OIAE. e Schematic of the transdermal active ingredient delivery amplification mechanism in CNFs-based OIAE (scale: 1.5 mm). The mechanism involves the OIA providing conformal contact with the skin due to preload-induced structural behavior (left and middle), while the conductive layer facilitates microcurrent stimulation to enhance active ingredient delivery (right).
Optimizing CNFs-OIA for high-resolution patterning and active ingredient absorption
The CNF-OIA were fabricated using the following process (Fig. 2a). The CNFs were placed on a SUS master mold patterned with OIA. To ensure the full conformation is placed on a SUS master mold patterned with the OIA. To ensure the CNFs fully conforms to the contour of the mold, an elastic damper (Ecoflex-0050) is placed on top of the CNFs, and imprinting is performed at optimized temperature and pressure. We optimized temperature and pressure to fabricate CNFs-OIA that satisfy the following conditions: (1) formation of a high-resolution three-dimensional structure, (2) maintenance of the structure after absorption of the active ingredient with viscosity, and (3) an appropriate temperature that prevents the CNFs from burning during the imprinting process. First, the glass transition temperature (Tg) of the CNFs was measured to identify the temperature that facilitates structural patterning. When imprinted at the same pressure (500 MPa), a temperature higher than Tg (~100 °C) was required for precise patterning of CNFs (Fig. 2b). In particular, the CNFs-OIA manufactured at a temperature of 150 °C was prevented from burning and maintained its structure even when a high-viscous active ingredient (~70,000 Pa∙s) was absorbed (Supplementary Fig. 1). Then, we optimized the imprinting pressure for high-resolution patterning. We fabricated CNFs-OIA at a pre-optimized temperature of 150 °C and various pressures (60, 100, 250, and 500 MPa) to absorb the fluorescent solution (rhodamine B). The results of observing the structure with a confocal microscope confirmed that the CNFs-OIA fabricated at 500 MPa had the most precise structural implementation (Fig. 2c and Supplementary Fig. 2). We selected HA as the active ingredient in our adhesive, known for its distinctive skin-regenerating effects: 1. including wrinkle reduction, 2. Hydration and 3. pore minimization42. To explore the applicable concentration of HA for use in the CNFs-OIA, we measured the viscosity according to the concentration of HA (0, 1, 5, 10, 15, and 20 wt%) (Fig. 2d). As the HA concentration increased, the viscosity also increased and tended to be saturated, especially at 15 wt% (~70,000 Pa∙s). Interestingly, the contact angle on various surfaces including CNFs changed with increasing HA concentration (Fig. 2d and Supplementary Fig. 3). This behavior of liquid droplets is because the intermolecular interactions are enhanced at high HA concentrations, which restricts the movement of molecules and results in a gel-like state. To investigate the change in the mechanical properties of the CNFs, HA solutions with various concentrations (w/o, 1, 5, 10, 15 and 20 wt%) were absorbed and the tensile strain was measured (Fig. 2e and Supplementary Fig. 4). When CNFs was absorbed with HA concentrations of 1, 5, and 10 wt%, the tensile strain exhibited non-significant change compared to CNFs without HA. In contrast, the tensile strain significantly increased when 15 and 20 wt% HA was absorbed. This result occurred because the high concentration of HA acted as a filler between the CNFs43,44. HA concentration has a significant effect on the structural maintenance of the 3D patterned OIA. After the CNFs-OIA sufficiently absorbed HA, the OIA gradually collapsed as the HA concentration and its role as a filler increased (Fig. 2f, g and Supplementary Fig. 5)43,44. The initial height of the patterned OIA in the CNFs was designated as h0 and the height after HA absorption was designated as h, to derive the degree of structure maintenance ((h-h0)/h0, %). The results of analysis confirm the gradual deformation and collapse of the OIA with increasing HA concentration in the top and side views. According to the results, the OIA maintained more than 90% of its initial height when the HA concentration was absorbed up to 15 wt%. However, when 20 wt% HA was absorbed, it collapsed significantly to about 60%. The “maintainable area” shown in Fig. 2f highlights the HA concentration range where structural maintenance is guaranteed. This demonstrates that the CNFs-based structure is insufficient to maintain its structural shape at extreme HA concentrations. The structural formation and collapse behavior of HA-loaded CNFs were further corroborated by confocal microscopy imaging (Supplementary Fig. 5). Additionally, the CNFs-OIA fabricated by the optimized process exhibited superior structure maintenance performance compared to the patterned commercial patterned CNFs (Supplementary Fig. 6). While the commercial CNFs immersed in high-viscous active ingredients (~70,000 Pa∙s) were observed to exhibit structural disintegration, the CNFs-OIA stably maintained their structures (Supplementary Figs. 1, 2, 5, 6).
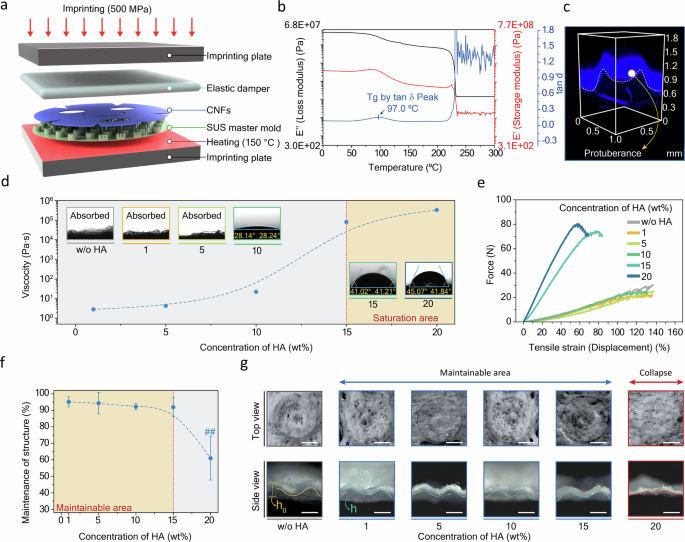
a Schematic of the fabrication process for CNFs-based OIA. b Measurement of the glass transition temperature (Tg) of CNFs using differential scanning calorimetry (DSC) analysis. c Structural integrity of CNFs-based OIA under a fluorescent solution, fabricated at 500 MPa and 150 °C. d Viscosity of HA at different concentrations (1, 5, 10, 15, and 20 wt%); N = 3. The inset shows contact angles of HA with varying concentrations (w/o, 1, 5, 10, 15, and 20 wt%) on CNFs. e Stress-strain curves of CNFs absorbed with HA at different concentrations (w/o, 1, 5, 10, 15, and 20 wt%). f Structural maintenance performance of CNFs-based OIA at different HA concentrations (w/o, 1, 5, 10, 15, and 20 wt%); N = 10. g Photographs from two perspectives (top, scale: 1 mm; bottom, scale: 0.6 mm) of CNFs-based OIA absorbed with HA at varying concentrations (w/o, 1, 5, 10, 15, and 20 wt%). Statistical analysis was done by One-way ANOVA test followed by Turkey’s Multi-comparison test. #P < 0.05, ##P < 0.01, and ###P < 0.001 versus 1 wt% concentration of HA. n.s. not significant.
Analysis of adhesive performance according to HA concentration in CNFs-OIA
The CNFs-OIA exhibited structural and functional differences due to protuberances compared to the CNFs-hole. In the top view, protuberance appears as a dome shape inside the OIA, which is different from the hole. These structural differences are also evident in the cross-sectional view (Fig. 3a). We analyzed the influence of each structural feature and HA on the adhesive performance. With the application of a preload (5 kPa), the diameter (\({D}_{{out}}\mbox{”})\) “fter attachment increases further compared to the initial diameter of the structure (\({D}_{{out}}\)). Consequently, The total adhesive force (\({\sigma }_{{total}}\)) of the CNFs containing the viscous liquid is expressed as follows (see Supporting Theory section for details)14,39,40,45,46,47.
$${\sigma }_{{total}}={\sigma }_{{capillrary}}+{\sigma }_{{suction}}+{\sigma }_{{viscous}}$$
(1)
$${\sigma }_{{capillrary}}=\left[\frac{\pi \cdot ({{\rm{\mbox{”}}}}^{2}-{{\rm{\mbox{”}}}}^{2}+{4r}^{2})}{4}\cdot \gamma \left(\frac{\cos {\vartheta }_{1}+\cos {\vartheta }_{2}}{h}\right)+l\cdot \gamma \right]\cdot n$$
(2)
$${\sigma }_{s{uction}}=\left[\frac{{{P}_{0}\pi {\rm{\mbox{”}}}}^{2}\epsilon }{4}\right]\cdot n$$
(3)
$${\sigma }_{{viscous}}=\left[\frac{6v\cdot {\rm{\eta }}\cdot \pi }{h}\cdot \frac{(\text{‘}{\text{‘}}^{2}-\text{‘}{\text{‘}}^{2}+{4r}^{2})}{4}\right]\cdot n$$
(4)
$${\sigma }_{{total}}=\left[\frac{{{P}_{0}\pi \text{‘}\text{‘}}^{2}\epsilon }{4}+\frac{\pi ({\text{‘}\text{‘}}^{2}-{\text{‘}\text{‘}}^{2}+{4r}^{2})}{4}\cdot \left(\frac{6v\cdot {\rm{\eta }}}{h}+\gamma \left(\frac{\cos {\vartheta }_{1}+\cos {\vartheta }_{2}}{h}\right)+l\cdot \gamma \right)\right]\cdot n$$
(5)
where \(D\text{‘}\text{‘}in\) is the inner diameter and \(D\text{‘}\text{‘}\,out\) is the outer diameter of the contact surface under a preload, \(r\) is the radius of the protuberance in contact with the substrate, \({\vartheta }_{1}\) is the contact angle of CNFs and viscous liquid, \({\vartheta }_{2}\) is the contact angle of the viscous liquid on the engaged substrate, \({P}_{0}\) is atmospheric pressure (∼101.3 kPa), \(\epsilon\) is the volume change ratio according to viscosity, \(v\) is the sliding velocity, \(\eta\) is the viscosity of the liquid, \(\gamma\) is the surface tension of the viscous liquid depending on concentration, and \(n\) is the number of adhesive structures. We compared the theoretical and experimental adhesion performances of CNFs-OIA to pig skin at different HA concentrations (0, 1, 5, 10, 15, and 20 wt%) (Fig. 3b and Supplementary Fig. 7). The experimental adhesion performance of CNFs-OIA increased with increasing HA concentration and showed a higher adhesion performance than other CNFs-based structures (hole, flat), indicating a clear correlation between the structural characteristics of OIA and the adhesion performance. Additionally, the synergistic effect of OIA and viscosity force was evident. Interestingly, when 20 wt% HA was absorbed, a synergistic effect between structure and viscosity on adhesion was not observed, indicating that the excessive viscosity of high-concentration HA hindered structural maintenance and function (inducing suction force (\({\sigma }_{{suction}}\))) as the OIA collapsed. Confocal microscopy imaging further confirmed that the nanopores were filled with HA, allowing HA-absorbed CNFs-OIA to maintain their structural functionality. Furthermore, the extent of the structural behavior was found to vary with the degree of collapse of the CNFs induced by the absorption of 20 wt% HA (Supplementary Fig 5). This is also consistent with the correlation analysis between viscosity and structural maintenance, as shown in Fig. 2f, g. In conclusion, the experimental values are consistent with the theoretical prediction that structural features significantly contribute to adhesion performance. The synergistic effect of structural design and viscosity was clearly demonstrated in the shear-direction adhesive performance while the CNFs-OIA also exhibited excellent and repeatable adhesion under excessive bending and humid conditions (Fig. 3c and Supplementary Figs. 8, 9). Additionally, the theoretical prediction that the CNFs-hole without protuberances would show a lower adhesion performance than the CNFs-OIA was corroborated by actual experimental values (Supplementary Fig. 10). We conducted a finite element method (FEM) simulation to analyze the effect of the unique protuberances on the adhesion performance (Fig. 3d and Video S1). The HA-adsorbed CNFs-OIA contacted the skin interface via the following mechanism: (1) application of a preload (~5 kPa), (2) induction of structural deformation and interfacial contact with the protuberance, (3) maintenance of interfacial contact with protuberance after preload removal. These mechanisms amplify the interaction with the interface by ensuring additional contact while generating local negative pressure. In addition, we analyzed the behavior of the CNFs-hole without protuberances (Fig. 3e and Supplementary Fig. 11 and Video S1). The hole differs from the OIA not only in securing the contact area but also in its capacity to generate negative-pressure. Regarding the internal chamber volume change, which is a key indicator of negative-pressure formation, the holes differed significantly from the OIA (Fig. 3f). This suggests that the presence of protuberance contributes to inducing a high level of negative-pressure via significant structural volume deformation.
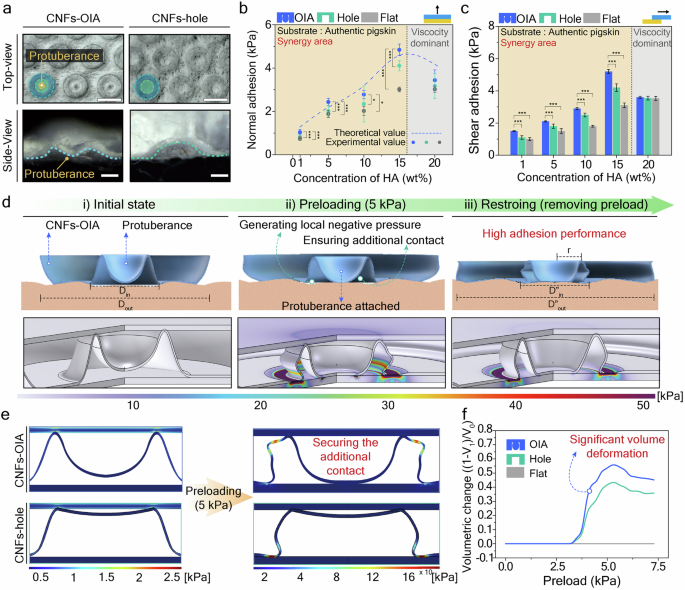
a Photographs comparing samples with (CNFs-OIA) and without (CNFs-hole) protuberances (top, scale: 1.5 mm; bottom, scale: 0.6 mm). b Normal adhesion performance on a pigskin substrate under different HA concentrations (w/o, 1, 5, 10, 15, and 20 wt%), showing predicted values for the OIA (blue dotted line) and experimental values (blue dots: OIA, green dots: Hole, gray dots: Flat); N = 10. c Shear adhesion performance on a pigskin substrate under different HA concentrations (w/o, 1, 5, 10, 15, and 20 wt%), presented as experimental values (blue columns: OIA, green columns: Hole, gray columns: Flat) for all groups; N = 5. d Schematics of the adhesion mechanism of a single CNFs-OIA during preloading and after unloading (top row), and FEM simulation of the corresponding stress distribution (bottom row). e FEM simulations comparing structures with (CNFs-OIA) and without (CNFs-hole) protuberances. f Rate of volume change in the inner chamber under different preloads for samples with (blue line: OIA) and without (green line: Hole) protuberances, as well as non-patterned samples (gray line: Flat). Statistical analysis was done by One-way ANOVA test followed by Turkey’s Multi-comparison test. *P < 0.05, **P < 0.01, and ***P < 0.001 versus OIA. n.s. not significant.
HA delivery performance of CNFs-based adhesives according to structure and concentration
Experiments were conducted to investigate the impact of the improved adhesion provided by the OIA on the actual HA delivery depth. Adhesives loaded with active ingredients and exhibiting enhanced adhesion to the skin can promote deeper delivery of the active ingredients40. To analyze the delivery of active ingredients into the skin, 15 wt% HA tagged with a fluorescent probe (rhodamine B) was absorbed onto CNFs with different structures (OIA, hole, and flat). CNFs-based adhesives were attached to pig skin at room temperature (~25 °C), and delivery depth was measured using confocal microscopy at different application times (10, 20, and 30 min) (Fig. 4a, b and Supplementary Fig. 12). The results showed that CNFs-OIA delivered HA to a depth of ~110 μm in porcine skin over 30 min, demonstrating greater delivery depth compared to other adhesives (hole, flat). Additionally, the increase in delivery depth became negligible beyond 20 min of application; therefore, the application time was set to 20 min. A 20 min application time was found to be appropriate, as it did not interfere with the synergistic adhesion performance between CNFs-OIA and HA (Supplementary Fig. 13). We calculated the diffusion coefficient according to the application time for each structure using the delivery depth of rhodamine B-tagged HA (Fig. 4c). The diffusion coefficient expresses the change in the area occupied by the target substance per unit time; a higher value indicates greater diffusion. We expressed it based on the 2nd Fick’s law as follows (see the Supporting Theory section for details)39,40.
$$\frac{{c}_{{As}}-{c}_{A}}{{c}_{{As}}-{c}_{A0}}={erf}\left(\frac{z}{2\sqrt{{D}_{{AB}}t}}\right)$$
(6)
$${D}_{{AB}}={\left(\frac{z}{2{ter}{f}^{-1}\left(\frac{{c}_{{As}}-{c}_{A}}{{c}_{{As}}}\right)}\right)}^{2}$$
(7)
where cA is the HA concentration, cA0 is the initial concentration, cAs is the fixed surface concentration, z denotes the penetration depth, DAB is the diffusion coefficient, and t is the diffusion time. The CNFs-OIA attached and contacted the skin more closely than the CNFs-hole and flat surfaces, which increased the diffusion coefficient of HA. We analyzed the effect of HA concentration on the depth of delivery over a fixed application time (20 min). Delivery depth variations based on HA concentration (1, 5, 10, 15, and 20 wt%) showed that delivery depth into pig skin increased with higher HA concentrations (Fig. 4d, e, and Supplementary Fig. 14). Notably, at 15 wt% HA, CNFs-OIA delivered ~110 μm, CNFs-hole delivered ~99 μm, and the flat adhesive delivered ~87 μm. This delivery depth was greater than that of 20 wt% HA. These results indicated that the structural collapse at 20 wt% contributed to the adhesion performance, which also affected the delivery depth of the active ingredient. This observation was further supported by the diffusion coefficient analysis (Fig. 4f). Considering the results of various performance evaluations, including adhesion and delivery depth, CNFs-OIA with 15 wt% HA was adopted as the potential condition for enhancing the delivery performance of the active ingredients.
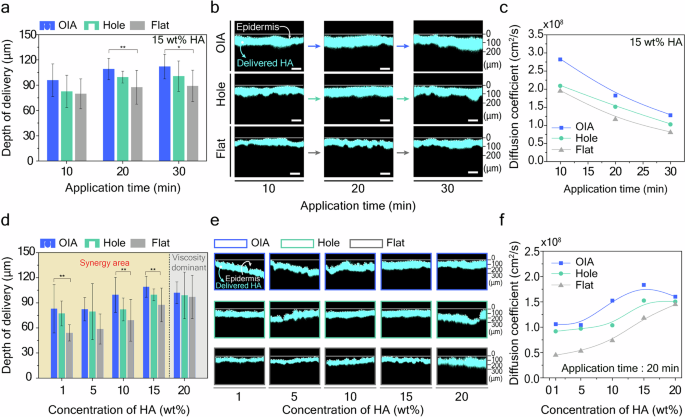
a Delivery depth of rhodamine B-tagged HA (15 wt%) through pigskin at different application times (10, 20, and 30 min) and structural types (blue columns: OIA, green columns: Hole, gray columns: Flat); N = 10. b Confocal microscopy analysis of rhodamine B-tagged HA diffusion through pigskin at different application times (10, 20, and 30 min). c Changes in the diffusion coefficient of rhodamine B in pigskin based on application time and structural type (blue line: OIA, green line: Hole, gray line: Flat). d Delivery depth, e confocal microscopy analysis, and f diffusion coefficient variation of rhodamine B-tagged HA at various concentrations (1, 5, 10, 15, and 20 wt%) through pigskin for different structural types (blue columns: OIA, green columns: Hole, gray columns: Flat) at a fixed application time of 20 min; N = 10. Statistical analysis was done by One-way ANOVA test followed by Turkey’s Multi-comparison test. *P < 0.05, **P < 0.01, and ***P < 0.001 versus OIA. n.s., not significant.
Optimization of CNFs-OIAE for amplification of HA transdermal delivery
To maximize the delivery of active ingredients through CNFs-OIA, we aimed to develop adhesive electronics capable of providing additional electrical stimulation and forming a conductive layer. SWCNTs are promising conductive materials due to their superior electrical performance26,48,49,50. A simplified spray-coating method was employed to deposit SWCNTs (Fig. 5a) on the opposite side of the skin-contacting surface (Fig. 5b). Conductive layer, which does not encounter skin, ensures the intrinsic biocompatibility of the CNFs. The application of physiologically similar microcurrents (~50 μA) enhances active ingredient delivery in multiple ways: (1) inducing ionization and electrostatic repulsion of active ingredient particles and (2) reducing electrical resistance on the skin’s surface (Fig. 5c)27,28,29,30,31,32,33. This level of current has been reported to pose minimal risk of adverse effects on the skin51,52. The stably formed conductive layer also enables the application of microcurrents via CNFs-OIAE. To ensure stable and efficient conductive layer formation, the amount of sprayed material was optimized. We analyzed the electrical resistance per unit area concerning the SWCNT spray amount and confirmed that the minimum saturation point was reached at 0.75 mL/cm2 (Fig. 5d). Subsequently, we verified whether the microcurrents induced by the measured CNFs-OIAE values were similar to those observed physiologically. A commercial product with a 5 V rating was used as the power source, and the induced current values were measured using an oscilloscope (Fig. 5e and Supplementary Figs. 15, 16 and Video S2). The measured signal was comparable to physiologically induced current values of ~50 μA. Finally, we examined the effect of HA on the electrical performance of CNFs-OIAE (Supplementary Fig. 17). Surprisingly, the CNFs-OIAE containing the active ingredient showed minimal resistance changes, and this trend was further enhanced with increasing HA concentrations owing to the unique negative charge properties of HA28. We verified the amplification potential of HA delivery efficiency using the CNFs-OIAE. First, we aimed to demonstrate that the electrical resistance of the stratum corneum was reduced by microcurrents (Fig. 5f). The electrical resistance of the stratum corneum, which is much higher than that of other skin layers (epidermis and dermis), is a major factor that hinders the delivery of ionic particles32. We measured the initial skin resistance of five volunteers, then applied microcurrent, and monitored the resistance at 5 min intervals. Interestingly, a clear decrease was observed in the electrical resistance of the skin immediately after the application of the microcurrent, although individual differences existed. This decrease may help effectively deliver charged active ingredients into the body. Additionally, we confirmed that skin resistance rapidly returned to its initial level (~5 min) after the current supply was stopped, verifying the transient and non-destructive nature of our approach. We then examined the depth of active ingredient delivery (Fig. 5g, h, and Supplementary Fig. 18). The comparison groups included CNFs-OIAE, CNFs-OIA, and a simple topical application of HA. The HA concentration used in this experiment was optimized to 15 wt%. Across all application times (10, 20, and 30 min), the CNFs-OIAE exhibited a significantly superior delivery depth compared to the other groups. In addition, we adopted this delivery time because the HA delivery depth was observed to saturate at 20 min. Thereafter, we observed the skin moisture content according to the HA delivery method (CNFs-OIAE, CNFs-OIA, and topical) in the five volunteers (Fig. 5i). Various delivery methods, including CNFs-OIAE and subsequently HA, were applied to the skin of volunteers for 20 min. The application of the CNFs-OIAE resulted in the highest skin moisture content compared to the other groups. This exceptional hydration effect remained high not only immediately after the removal of the CNFs-OIAE but also for a sustained period (5, 10 min) following application discontinuation. Additional comparative analysis with CNFs-flat conducted through the same experiments further highlighted the superior performance of CNFs-OIAE, which demonstrated enhanced multifunctionality compared to conventional materials (Supplementary Fig 19). Furthermore, FTIR spectral analysis confirmed the safety of use by verifying the complete absence of residue on the skin surface, in contrast to the case where the SWCNT film was applied alone (Supplementary Fig. 20).
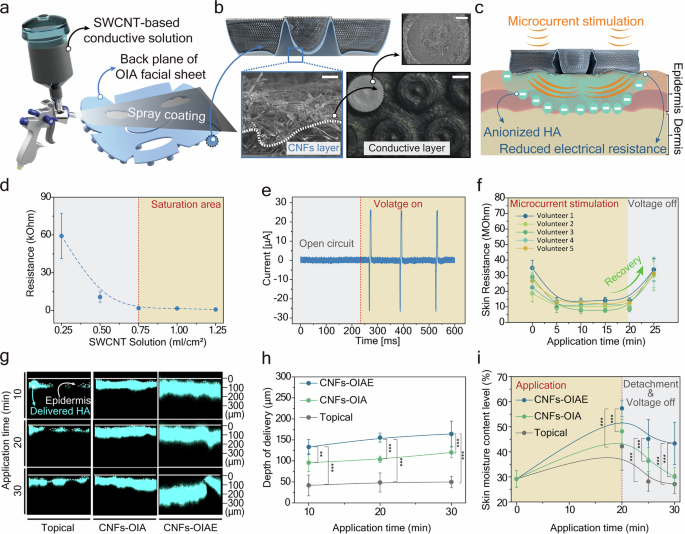
a Schematic of conductive layer formation on CNFs-OIA via spray-coating of single-walled carbon nanotubes (SWCNTs). b Schematic of a single CNFs-OIAE (top left). Low-magnification SEM images showing two individual layers: CNFs and the conductive layer (bottom left, scale: 100 μm). Photographic image (bottom right, scale: 1.5 mm) and SEM image (top right, scale: 500 μm) of CNFs-OIAE. c Schematic of the HA delivery mechanism via CNFs-OIAE, involving HA anionization and reduction of electrical resistance in the stratum corneum. d Optimization of SWCNT spray volume for conductive layer formation; N = 10. e Measurement of microcurrent generated by CNFs-OIAE using an oscilloscope (rated voltage: 5 V). f Measurement of skin electrical resistance before, during, and after CNFs-OIAE application; N = 5. g Confocal microscopy analysis of rhodamine B-tagged HA (15 wt%) diffusion through pigskin at different application times (10, 20, 30 min) using various mechanisms (CNFs-OIAE, CNFs-OIA, topical). h Delivery depth of rhodamine B-tagged HA (15 wt%) through pigskin at different application times (10, 20, 30 min) using various mechanisms (blue line: CNFs-OIAE, green line: CNFs-OIA, gray line: topical); N = 10. i Comparison of skin moisture content in volunteers following different application mechanisms for 20 min (blue line: CNFs-OIAE, green line: CNFs-OIA, gray line: topical); N = 25. Statistical analysis was done by One-way ANOVA test followed by Turkey’s Multi-comparison test. *P < 0.05, **P < 0.01, and ***P < 0.001 versus CNFs-OIAE. n.s. not significant.
Skin improvement effect of HA delivery through CNFs-OIAE
To assess the skin improvement effects of CNFs-OIAE, a clinical trial was conducted on three volunteers, delivering HA (15 wt%) daily for 7 d. The study included CNFs-OIAE and two comparison groups (CNFs-OIA and topical application), applied to the neck area of the volunteers (Fig. 6a). Before application, the skin was thoroughly disinfected, and the optimized delivery time was set to 20 min. Throughout the experiment, all application areas were assumed to be exposed to identical daily life conditions. The parameters assessed to evaluate skin improvement effects included three factors: roughness, fine line, and pore. First, the volunteers’ skin was captured as a two-dimensional image before the CNFs-OIAE application, and quantitative data for each parameter were collected (Supplementary Fig. 21). Subsequently, the degree of improvement for each of the three factors was analyzed according to the application group and date. In the skin roughness image, red and yellow indicate sunken areas, and blue and purple indicate protruding areas (Fig. 6b and Supplementary Fig. 22). When the CNFs-OIAE was applied, the average roughness of the volunteer skin improved more effectively (~40%) than that of the other control groups (CNFs-OIA: ~33%, topical application: ~30%) (Fig. 6c and Supplementary Figs. 23 and 24). This improvement was more evident in the maximum height analysis, which quantified the difference between the maximum peak and trough of the roughness profile (CNFs-OIAE: ~72%, CNFs-OIA: ~59%, and topical application: ~55%) (Fig. 6d and Supplementary Fig. 24). Fine line was defined as small wrinkles of 0.7 mm or less. Continuous application of CNFs-OIAE resulted in a significant decrease in the number of fine wrinkles in the area of interest, showing an overall improvement (CNFs-OIAE: ~196%, CNFs-OIA: ~138%, topical application: ~99%) (Fig. 6e, f and Supplementary Fig. 25). Additionally, the length (~40%), width (~40%), and depth (~72%) of the fine lines improved significantly compared with the control groups before and after application (Fig. 6g, h and Supplementary Figs. 23, 25). For pore analysis, the visualization and quantification of pores were performed first (Fig. 6i and Supplementary Figs. 21, 22). Effective delivery of HA through the CNFs-OIAE significantly reduced the pore count (CNFs-OIAE: ~85%, CNFs-OIA: ~77%, topical application: ~23%) (Fig. 6j and Supplementary Figs. 21, 22, 26). In addition, the pore area (~86%) and depth (~88%) also showed the greatest improvement when CNFs-OIAE was applied (Fig. 6k, l and Supplementary Fig. 26).
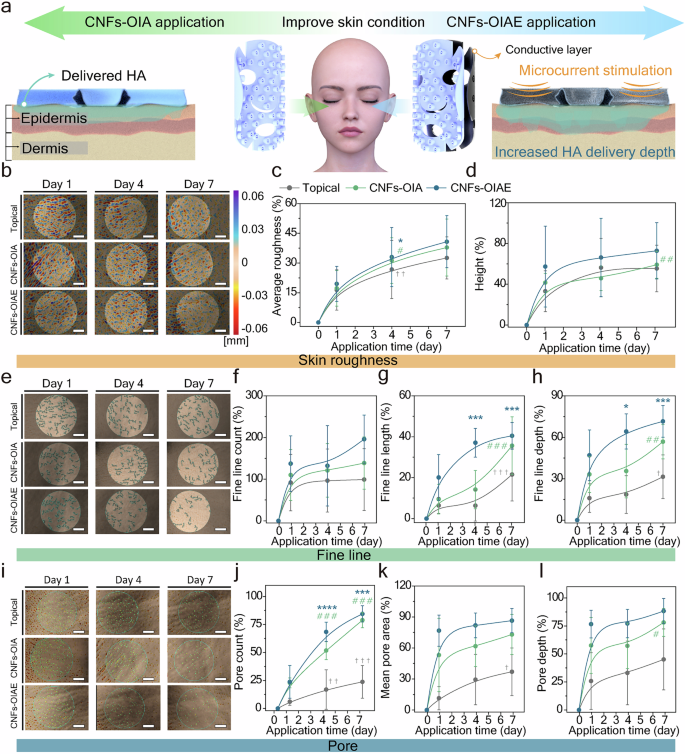
a Schematic diagram illustrating various HA delivery mechanisms to the skin (CNFs-OIA, CNFs-OIAE). b–d Assessment of skin roughness following different HA delivery mechanisms (blue line: CNFs-OIAE, green line: CNFs-OIA, gray line: topical) at different application times (1, 4, 7 days). b Representative images of volunteers’ skin roughness (scale: 1 mm). c Changes in the mean deviation from a straight line within the evaluation length. d Changes in height between the maximum peak and the minimum point of the profile; N = 12. e–h Assessment of fine lines following different HA delivery mechanisms (blue line: CNFs-OIAE, green line: CNFs-OIA, gray line: topical) at different application times (1, 4, 7 days). e Representative images of volunteers’ fine lines (scale: 1 mm). f Changes in the number of fine wrinkles. g Changes in the total length of fine lines. h Changes in the average depth of fine lines; N = 12. i–l Assessment of pores following different HA delivery mechanisms (blue line: CNFs-OIAE, green line: CNFs-OIA, gray line: topical) at different application times (1, 4, 7 days). i Representative images of volunteers’ pores (scale: 1 mm). j Changes in the number of individual pores. k Changes in the mean pore area. l Changes in the average depth of pores; N = 12. Statistical analysis was done by One-way ANOVA test followed by Turkey’s Multi-comparison test. *P < 0.05, **P < 0.01, and ***P < 0.001 versus day 1 of CNFs-OIAE. #P < 0.05, ##P < 0.01, and ###P < 0.001 versus day 1 of CNFs-OIA. †P < 0.05, ††P < 0.01, and †††P < 0.001 versus day 1 of Topical. n.s. not significant.
link


More Stories
Flexible Electronic Skin Sensor Market: Manufacturer
Breakthrough Research Unveils Promising Route to Enhanced Durability in
Study points to potential fix